企业AI+创新
AI+创新战略
品牌DTC方案
RGM增长方案
品牌DTC转型
DTC全渠道零售
DTC会员电商
DTC社交电商
创新增长战略
PLG增长方案
AI+创新加速
AI+管理教练
AI+设计冲刺
企业敏捷转型
AI+创新指南2025
企业如何快速采用AI
重塑未来的战略
企业深科技创新
加强创新管控
上马GenAI创新
拥抱低成本创新
重构营销增长组织
社区驱动私域增长
营销GenAI应用
产品驱动销售PLS
导入创新运营
AI+创新训练营
企业AI创新工作坊
AI+增长战略工作坊
AI+品牌增长工作坊
AI+销售增长工作坊
AI+增长黑客训练营
AI+设计思维训练营
AI+敏捷管理训练营
创新学堂
创新讲座
创新工具
创新案例
创新智库
企业AI创新
产业创新洞察
新消费与新零售
企业技术与服务
新健康与医疗
创造DTC品牌
加速企业创新
创新业务增长
产品驱动增长
转型敏捷组织
精益产品创新
培养创新能力
提升创新领导力
运营创新转型
营销创新趋势报告
创作者中心
搜索:
登录
|
注册
企业AI+创新
AI+创新战略
品牌DTC方案
RGM增长方案
品牌DTC转型
DTC全渠道零售
DTC会员电商
DTC社交电商
创新增长战略
PLG增长方案
AI+创新加速
AI+管理教练
AI+设计冲刺
企业敏捷转型
AI+创新指南2025
企业如何快速采用AI
重塑未来的战略
企业深科技创新
加强创新管控
上马GenAI创新
拥抱低成本创新
重构营销增长组织
社区驱动私域增长
营销GenAI应用
产品驱动销售PLS
导入创新运营
AI+创新训练营
企业AI创新工作坊
AI+增长战略工作坊
AI+品牌增长工作坊
AI+销售增长工作坊
AI+增长黑客训练营
AI+设计思维训练营
AI+敏捷管理训练营
创新学堂
创新讲座
创新工具
创新案例
创新智库
企业AI创新
产业创新洞察
新消费与新零售
企业技术与服务
新健康与医疗
创造DTC品牌
加速企业创新
创新业务增长
产品驱动增长
转型敏捷组织
精益产品创新
培养创新能力
提升创新领导力
运营创新转型
营销创新趋势报告
创作者中心
搜索:
登录
该内容未找到哟~
您浏览的页面暂时未找到,您可以继续访问其他页面哦~
前往社区首页
大家都在看
最近大家都在关注的高价值创新洞见全在这里!
更多智库洞见
更多的知识
与全球领先创新智库和专家连接,由创新者、创业者和研究者共建共享的最IN的创新知识与实践
创新智库
每天更新由500+社区专业创作者原创或策展的创新洞见、创新指南、增长趋势、方案研究、实战技巧、以及创新工具
更新洞察
创新案例
1500+全球创新与增长案例每周更新,覆盖食品、智电、家居、医疗、企业科技、汽车、服装、美妆等全球20多行业
研究案例
创新学堂
3000+创新方法微课与工具,全球领先思维的中国实践,学习如何应用设计思维、增长黑客、敏捷管理、精益创业等专题
学习课程
创新方案
精选150+企业创新与增长方案,尤其旗舰的品牌DTC创新、战略创新、创新加速、增长创新、敏捷转型等热门方案
获取方案
欢迎来到
Runwise即能创新社区
Runwise.co是链接全球智库和专家,汇聚10万+专业企业创新者,创业者和研究学者参与的创新实践社区
还没有账号?
立即注册
01 畅读海量内参文章,
注入创新观点
创新内参涵盖数字领域最新最热的专业洞见、创新指南、增长趋势、方案研究、实战技巧以及创新工具,可以帮助创新爱好者拓宽视野,每天都能获得新知识,新观点
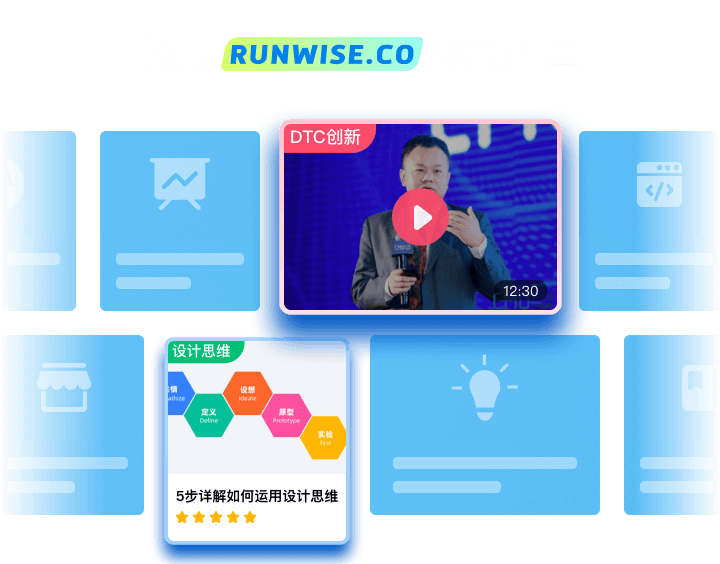
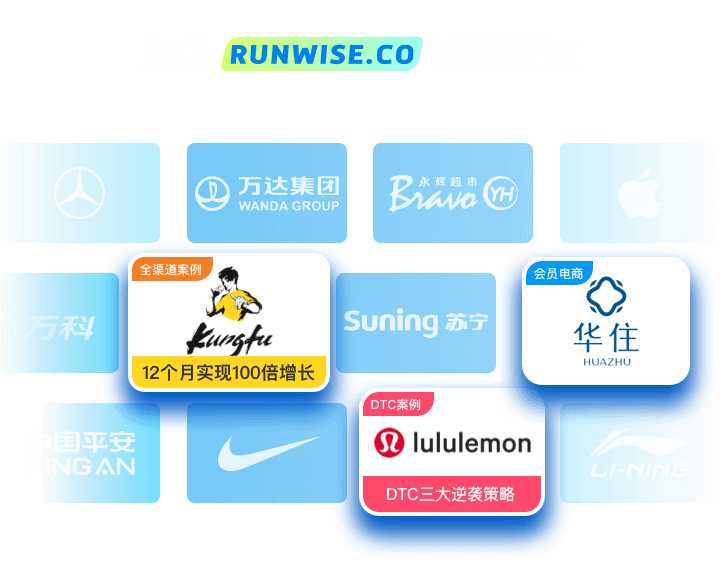
02 学习最新实践案例,
启发创新构想
创新案例精选快消品、智能家居、互联网、企业科技、汽车、服装、美妆等20多个行业的全球创新与增长案例,是创新研究时的最好参考,构想创新方案的最佳对标
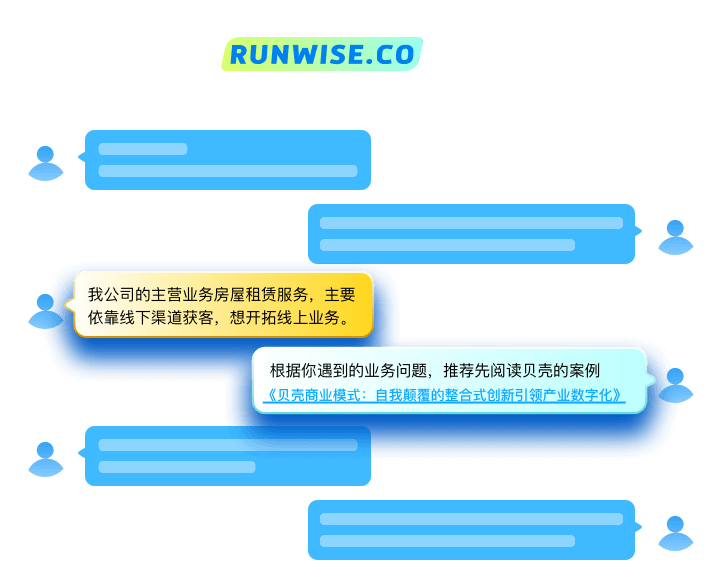
03 与创新专家共创,
找到增长新机会
创新专家25年+专注战略与转型,帮助200+国内外知名企业完成业务创新、DTC增长、敏捷转型。与专家一对一交流,找到真正值得解决的业务难题,构想低成本高效率的解决方案
04 边学边做,
加速思维和行动改变
创新思维包括 300+ 门涉及思维、增长黑客、敏捷管理、精益专业等专题的课程,1250+ 拿来就能用的创新工具,帮助团队“学中做”,以练代培的训练营,让团队实现“做中学”
欢迎来到Runwise即能创新社区!
登录账号
注册账号
记住我
忘记密码?
登录账号
注册账号
还没有账号?
立即注册
已有账号?
立即登录
电话咨询
400-822-8832
7x24热线,欢迎致电咨询
微信咨询
扫码添加专家微信
享专家1V1咨询